
Two extremely helpful tools when dealing with sales datasets are Summary Tiles and Views.
- Summary Tiles are visual calculations of a specific metric that can be linked to a filter.
- Views are rearrangements of the dataset to meet a specific purpose.
Summary Tiles
In Excel, it is best to create Summary Tiles on a separate page tab and then float the image as a linked picture on the page you need it. This way, you are not restricted to the table layout of the dataset you are working with.
See the example video below:
Once you have created the Summary Tiles, you can add a macro to filter them by the metric they are measuring.
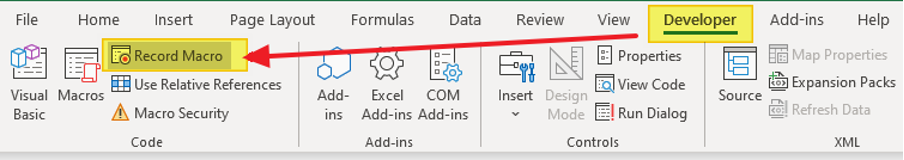
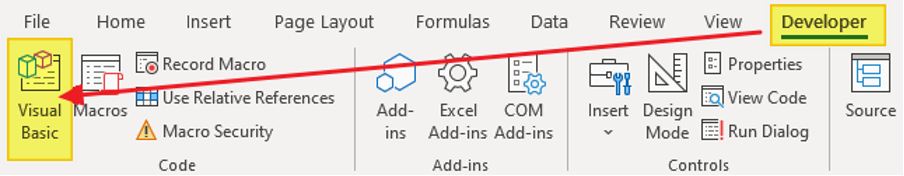
To create a macro, go to the Developer Tab and press Record Macro
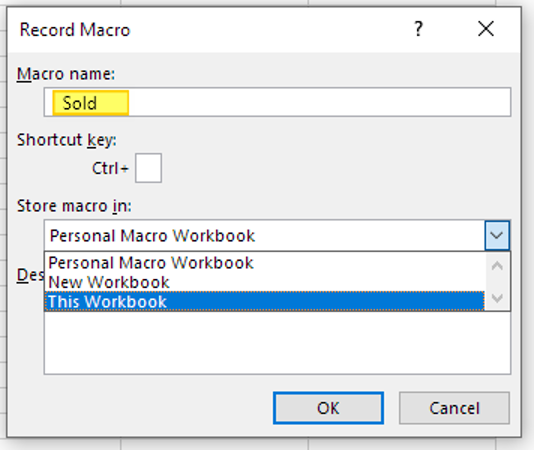
Name the Macro as Sold and store it in This Workbook
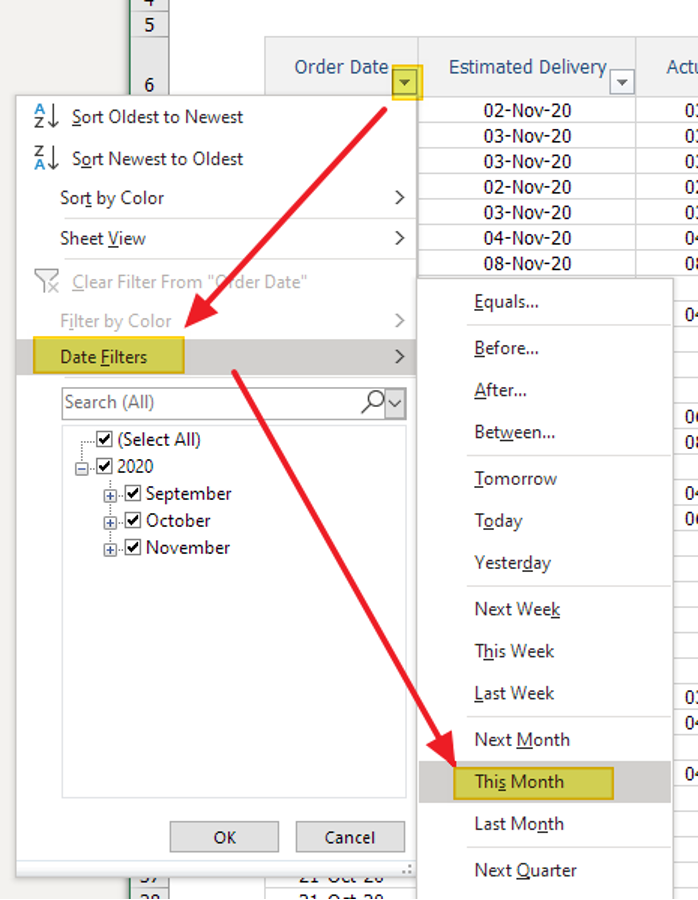
Once the macro is recording, Filter the Order Date Column by This Month
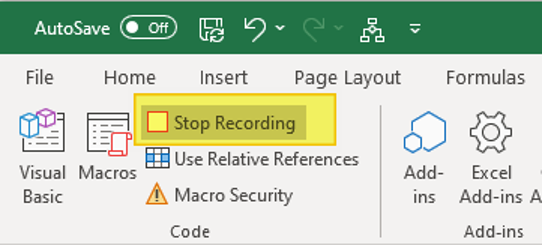
And then Stop Recording
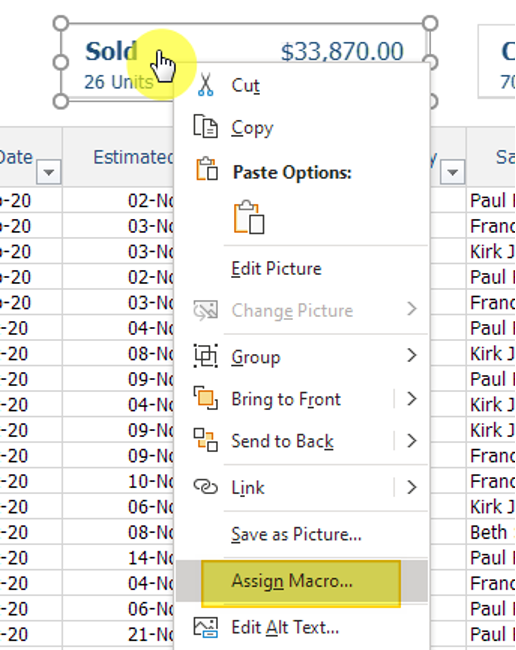
You can then attach the Macro to the Tile by right clicking it and selecting Assign Macro
Follow the same steps to create and attach macros for Covered and Delivered
Views
Views are similar to the filters that we attached to the Summary Tiles, but instead, the logic is attached to a button. These are useful when you want to see the data arranged in a particular way.
The example below only filters the data down to undelivered records; however, you could also hide and rearrange the columns to help suit the purpose of the view.
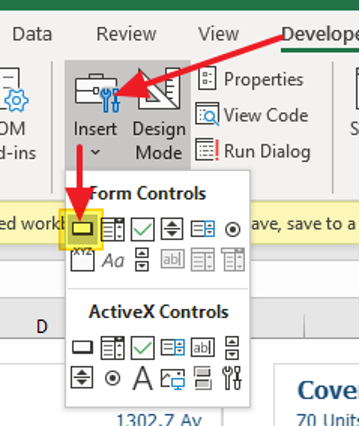
To create a Button, under the Developer Tab, click Insert and then select the button icon.
In the workbook example you can download below, I have created two buttons -
- Show All
- Deliveries
The purpose of the Show All button is to unfilter any of the other filters that have been applied.
You will need to use the below code example so that it doesn’t create any errors when there is no data to un-filter.Go to the Visual Basic Editor and create an additional macro as per below
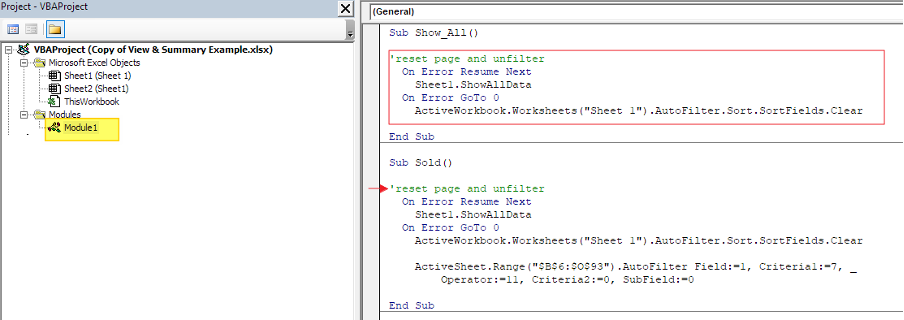
You can see that I have added the same Un-Filter code to all the other macros. This way, each macro will un-filter the dataset before applying any new logic.
You can DOWNLOAD the example workbook below which contains all the macros shown in this article.
I have kept each macro as simple as possible, but these can definitely be expanded on.
